
The Death Shape
Your benchmark says it's fast. My benchmark asks where it breaks.
A “fast” event bus in a happy-path microbench tells you nothing about how the library falls apart when you push it. I wrote a companion stress suite for rt-event-benches because I wanted to know exactly where each library gives up, and what shape the failure takes.
Five languages, five libraries, five ways to fail. No library survives every axis. None of them fail the same way.
All the data and code is in the repo. The charts below come from results/stress.csv (149 rows across five libraries) and scripts/plot-stress.py. The spec is STRESS.md.
The setup
Same cast as the first post: Rust rt-events, C++ entt::dispatcher, Go asaskevich/EventBus, Node eventemitter3, Python blinker. Five stress axes, each a geometric ramp (×10 per step). The harness runs each step with taskset, timeout 90s, and /usr/bin/time -v. A crash stops the ramp; the last surviving value is the breaking point.
The five axes:
subscriber_count: N handlers for one event, dispatch once. Ramp: 10 → 100M.payload_size_bytes: one event with an N-byte payload. Ramp: 8 B → 16 GiB.sustained_rate: N emits in a tight loop to 10 subs, sample p99/median. Ramp: 10k → 1B.recursive_emit_depth: handler re-emits itself D times. Ramp: 1 → 1M.unsubscribe_during_dispatch: three pass/fail probes (self, ahead, behind).
Full contract: STRESS.md.
Instrumented essay
What changed in this version of the essay
+
Instrumented essay
What changed in this version of the essay
The original post linked out to CSVs and remote chart assets. This version keeps a curated stress snapshot in the blog repo, indexes it into SQLite during the build, and lets the article expose the death matrix and sustained-rate slice as explorable tables instead of inert markdown.
The death matrix
benchmark
Stress matrix
This is the same death matrix, but now the evidence chips are explorable and the rows can be sorted by whichever axis you care about most.
rows
5
Sort
Library
Source
rt-event-benches / results/stress.csv
entt is the strongest direct competitor in the happy path, which makes its failure profile interesting rather than embarrassing.
| Source | ||||||
|---|---|---|---|---|---|---|
| C++ entt | hang @ 1M | oom @ 16G | hang @ 1B | segfault @ 100k | ok | |
| Go EventBus | hang @ 100M | oom @ 16G | hang @ 10M | wrong_result / deadlock @ 2 | ok | |
| Node ee3 | hang @ 100M | "ok" @ 16G | hang @ 100M | panic @ 10k | ok | |
| Python blinker | hang @ 10M | oom @ 16G | hang @ 10M | ok @ 1M | ok | |
| Rust rt-events | ok @ 100M | oom @ 16G | hang @ 1B | stack_overflow @ 1M | statically disallowed |
Read “ok @ N” as “completed the largest value we tested without crashing, so we don’t know where its real breaking point is.” Read “hang” as “didn’t finish in 90 seconds.” Everything else is a real crash with a specific signal or exception.
The grid is brutal: even at 149 data points, the five libraries crash in five different shapes. That’s the story.
Subscriber count: flat beats clever
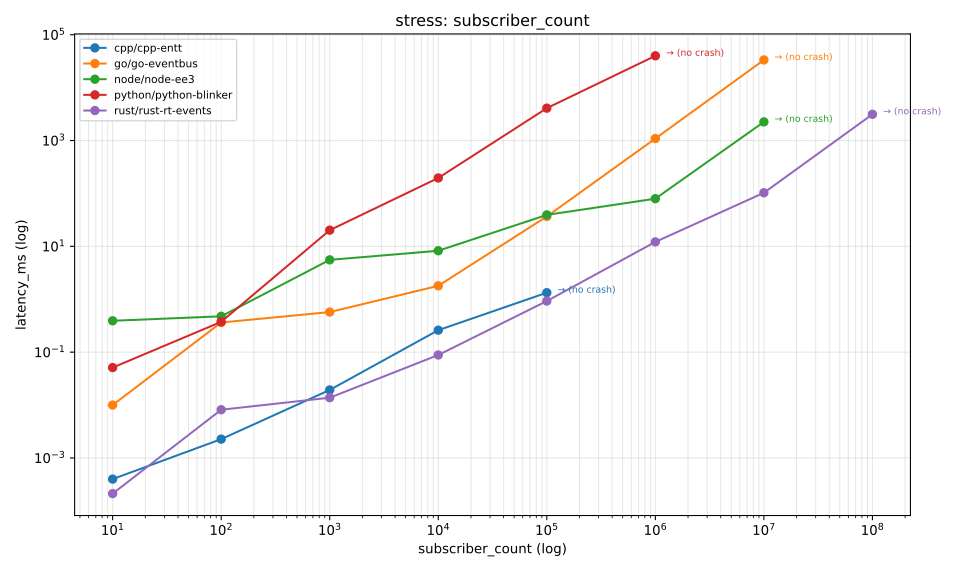
Subscriber count ramp
The chart is stored locally now, but still sourced from the same benchmark harness. The point is the storage story, not the exact line geometry.
This axis registers N handlers for one event and then emits once. It’s the simplest thing a dispatcher has to do, and it exposes the library’s internal data structure more directly than any other axis.
- rt-events completed 100M subscribers in 3.1 seconds and didn’t crash. The hot path is
for fn in vec { (fn.trampoline)(fn.data, &event) }— a flatVec<(data_ptr, fn_ptr)>walk. No hashing, no reflection, no GC barriers. 100M pointer chases fit in ~1.6 GiB of contiguous RAM. - Node EE3 hung at 100M. Last completed value: 10M in 2.3 seconds. EE3 stores listeners in a JS array; at 10M entries you’re paying for V8’s backing-store growth and its GC visiting all of it.
- Go EventBus took 33 seconds at 10M and hung at 100M. Each subscriber holds a
reflect.Value+ a name string in a map-of-slice-of-struct. Reflection is not free even when you aren’t dispatching. - C++ entt was the most surprising: 100k registered in 1.3 ms, then hang at 1M.
entt::sighstores calls in astd::vector<delegate>but doing 1Msink.connectcalls runs into reallocation cost that scaled worse than I expected. - Python blinker hung at 10M. Blinker tracks receivers in a
WeakValueDictionary; at that scale, the dict’s rehash + weakref book-keeping dominated.
For me the big lesson is: how your library stores subscribers is more important than how fast it dispatches them. A flat Vec or (fn_ptr, data_ptr) pair is ugly, but it wins at scale every time.
Payload size: Linux lied to me about Node
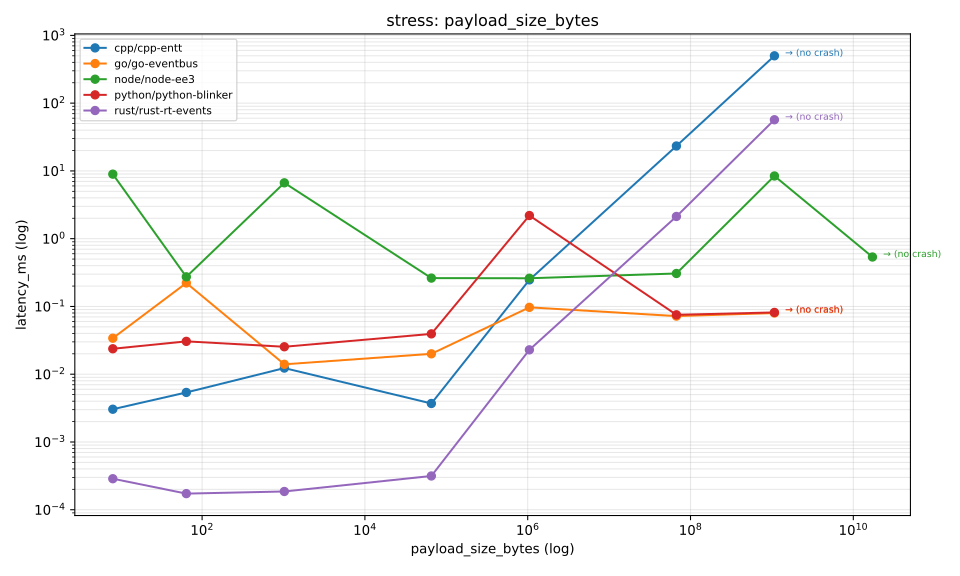
Payload size ramp
The misleading Node row is the whole reason I now want the evidence chips in the article itself instead of only in a remote CSV.
This axis emits one event whose payload is N bytes. The handler reads first+last byte to materialize the allocation. Ramp: 8 B → 16 GiB.
Everyone OOMs at 16 GiB — except Node, which reports ok in 0.5 ms.
node,node-ee3,payload_size_bytes,17179869184,ok,0.536668That’s wrong. Or rather: that’s Linux, not Node. Buffer.alloc(16 GiB) creates a V8 ArrayBuffer of 16 GiB; the backing allocation is an anonymous mmap of 16 GiB virtual memory. Linux doesn’t actually commit those pages until you touch them. Reading first+last byte only faults in 2 pages (8 KiB total). The kernel uses a single shared zero-page for all un-touched reads.
The row behind that claim is . The article version here keeps the weirdness attached to the claim instead of pushing it into a repo tab.
I left the number in the CSV because it’s real (the library didn’t crash), but it’s useless as a capacity measurement. A correct payload_size_bytes stress test would have the handler write to each byte. That changes the story: it becomes a memory-bandwidth benchmark, and Rust’s zero-copy Vec move starts to show its real advantage.
Lesson: “it didn’t OOM” is not the same as “it handled 16 GiB of data.” Always commit the memory you claim to test.
Sustained rate: the GC tax is real
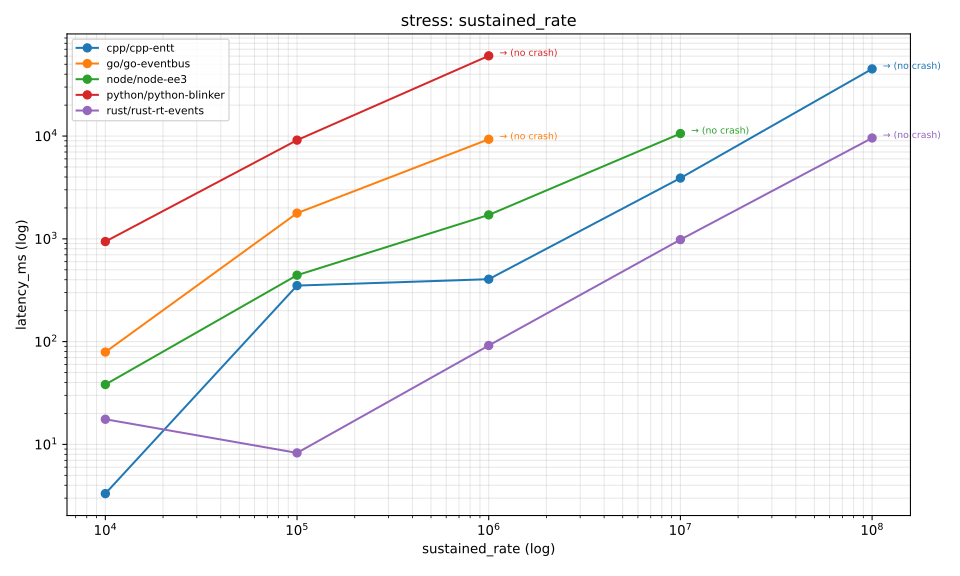
Sustained-rate ramp
The slope matters more than the single biggest number; the plot makes the GC story visible before you even read the table.
This axis emits N zero-sized events to 10 subscribers in a tight loop, sampling per-emit latency at a stride that yields ~1000 samples. The breaking point is p99/median > 100 (latency decoupling) or a crash.
Here’s the p99/median ratio at each library’s largest completed value:
benchmark
Sustained-rate slice
Sort by endurance, elapsed time, or p99/median ratio. The blank ratio cells are intentional: the snapshot only carried that signal for the libraries the article discusses explicitly.
rows
5
Sort
Last ok events
Source
rt-event-benches / results/stress.csv
A p99/median of 2.4x at 100M events is the article's shorthand for “nothing pathological happened.”
| Source | |||||
|---|---|---|---|---|---|
| rt-events | 100,000,000 | 9.6 | 2.4× | hang @ 1B | |
| entt | 100,000,000 | 45.0 | 9.7× | hang @ 1B | |
| Node ee3 | 10,000,000 | 10.6 | — | hang @ 100M | |
| Go EventBus | 1,000,000 | 9.3 | — | hang @ 10M | |
| Python blinker | 1,000,000 | 60.0 | — | hang @ 10M |
rt-events’ p99/median of 2.4× at 100M events means the worst-case emit was 2.4× the median. That’s what you’d get from a CPU branch misprediction at worst — no GC, no allocator fragmentation, nothing queuing up.
entt hits 9.7× — some of that is noise; some is L3-cache line displacement as the loop runs long enough to evict things.
Go EventBus maxes out at 1M events in 9.3 seconds, two orders of magnitude slower than rt-events. Every Publish allocates a []reflect.Value for the handler arguments. The Go GC catches up eventually and runs; p99/median ratio was already >10× at 100k events.
Python blinker does 1M events in 60 seconds. Every send() walks a WeakValueDictionary, dereferences weakrefs, acquires the GIL, and increments/decrements refcounts. Sustained-rate is where blinker’s design choices have nowhere to hide.
The shape of the chart matters more than any single number: the slope of latency-vs-rate is almost entirely GC discipline. Rust’s allocator is not being called inside the loop. Go’s reflect.Call is. Python’s every operation is.
Recursive emit depth: all five libraries fail differently
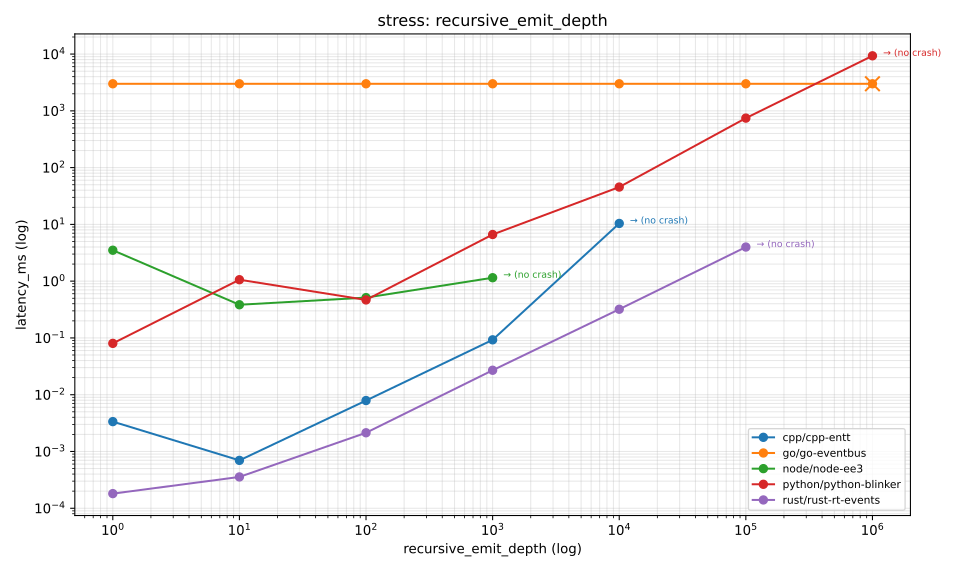
Recursive emit depth
This is the axis where every runtime feels like it is confessing something about itself.
This is the axis that taught me the most.
The handler re-emits the same event with depth - 1 and stops at 0. Every library has its own answer. Ranked by survival:
- Python blinker: did not crash at 1M. Python 3.14’s stack handling survived one million nested sends in 9.3 seconds. With
sys.setrecursionlimit(10**7). The C stack was fine. - rt-events: stack overflow at 1M (last ok at 100k in 4 ms).
- entt: segfault at 100k (last ok at 10k in 10 ms). Each entt frame is heavier than an rt-events frame — inlined templates put more on the stack per call.
- Node EE3: RangeError at 10k (last ok at 1k in 1 ms). V8’s default stack is small.
- Go EventBus: cannot recurse at all.
Publishholds a non-reentrantsync.Mutexacross the entire dispatch; any in-handler call toPublishdeadlocks. The stress binary detects this via a 3-second watchdog and reportswrong_result.
Go’s result is not a bug I discovered — it’s documented behavior. But “the library will deadlock if a handler calls back in” is the kind of thing that doesn’t show up on a perf benchmark and will absolutely ruin an afternoon in production. Great fucking job.
Python beating everyone else on depth is also a library-level win: blinker keeps its per-dispatch frame tiny, and CPython 3.14’s stack design keeps deep recursion from blowing out.
rt-events stack-overflows at 1M, which is roughly the single-threaded Linux process default stack (8 MiB). Each frame is the emit → trampoline → closure body → emit → … with ~8 bytes of stack each. That’s as good as I can get without switching to a trampoline queue, which would be a semantic change (no more Rust-native recursive dispatch).
Lesson: “re-entrancy” is a spec decision your library documentation rarely makes explicit. Stress-test it before you find out at 3 a.m.
Unsubscribe during dispatch: five different correct answers
The last axis runs three probes against each library: a handler that unsubscribes itself, one that unsubscribes a later sibling (ahead of the cursor), one that unsubscribes an earlier sibling (already fired).
Nobody crashes. Everyone gives a different answer:
- rt-events (Rust): statically disallowed.
emit(&self)takes a shared reference;off(&mut self)takes an exclusive one. A closure registered withoncannot capture&mut bus. The compiler rejects every version of this code. That’s the library’s answer to iterator invalidation: the class of bug is absent by construction. - entt (C++):
sink.disconnect()duringtrigger()uses swap-and-pop on the underlyingstd::vectorinside a reverse iteration. Result: one handler may get called twice, another zero times, depending on which sibling is disconnected. Defined, but surprising. - EE3 (Node): copy-on-write.
removeListenerallocates a new filtered array and re-assigns the map slot; the in-flightemitkeeps iterating the original (pre-remove) array. Net effect: everyone fires in the current emit; removal takes effect on the next emit. Elegant. - EventBus (Go): deadlock.
Unsubscribeacquires the same non-reentrant mutex thatPublishalready holds. Same 3-second watchdog as recursion. - blinker (Python): silently succeeds. Blinker iterates a snapshot of the receivers dict; disconnecting a receiver during dispatch just updates the dict for the next send.
Five libraries, five answers to the same question — and none of the answers are wrong. They’re design choices. “What does unsub-during-dispatch do on my library?” is not a question you want to discover empirically in production.
Breaking points overview
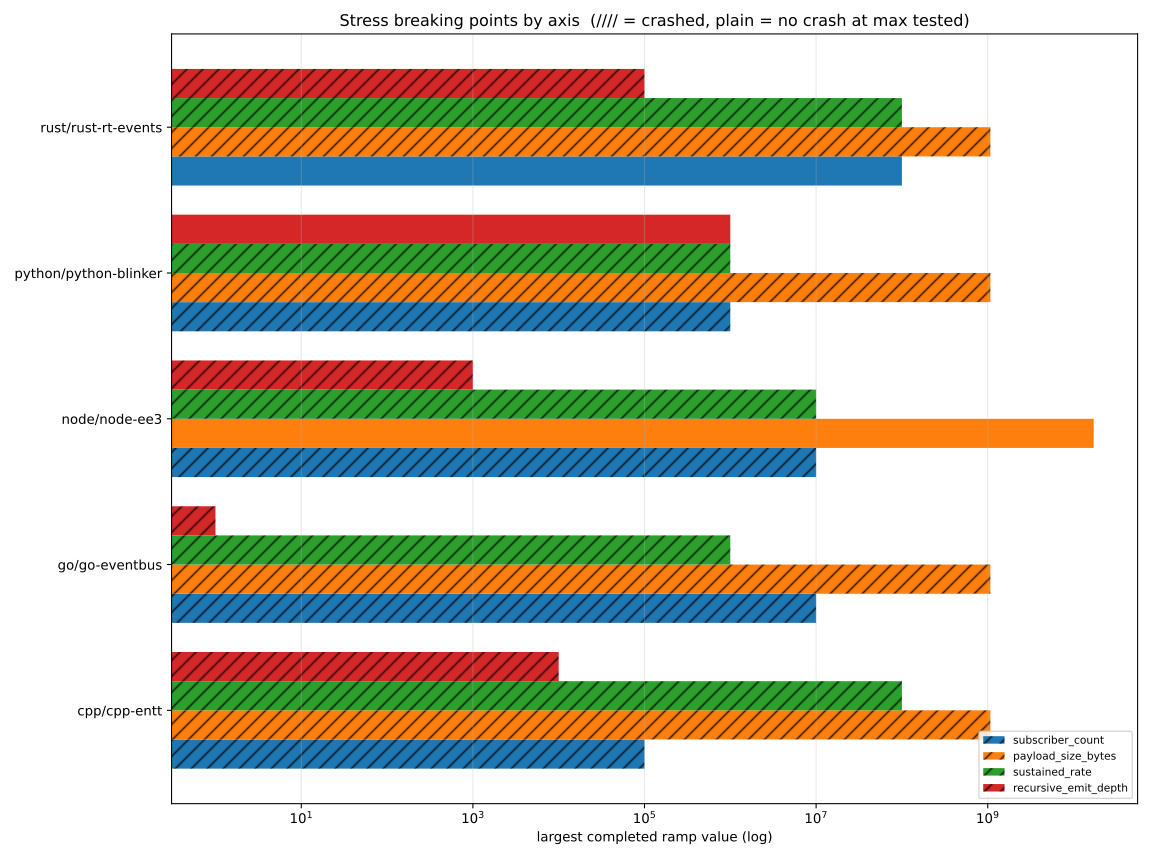
Breaking points overview
Plain bars mean the library survived the max tested value. Hatched bars mean it failed before that ceiling.
The bar chart shows the largest completed ramp value per library per axis. Hatched bars crashed; plain bars didn’t crash at the max we tested (we don’t know how much further they’d have gone).
If I had to pick one row that surprised me: rt-events surviving the full subscriber_count ramp (100M) without crashing. It took 3.1 seconds — not fast, but finite. The other four libraries hit a wall earlier because of how they store subscribers, not how they dispatch them.
Why you should stress-test
Perf benchmarks tell you how fast your hot path is. They don’t tell you:
- What breaks first (subscriber storage? payload allocator? reflection?)
- How it breaks (panic? segfault? silent wrong-result? deadlock?)
- At what scale (10k? 10M? 10B?)
- Whether “ok” means “handled it” or “didn’t touch it” (see the Node 16 GiB lazy-alloc case)
- What the library’s policy is on re-entrancy and iterator invalidation
Happy-path benchmarks lie by omission. They don’t distinguish between a library that does the right thing at the edge and one that deadlocks silently. Both can get 30 ns/op on the microbench.
Stress-test axes worth stealing for any pub/sub library you use:
- Max subscriber count per type
- Max payload size (with actual writes, not just allocation)
- Sustained emit rate (p99/median ratio over time)
- Recursive / re-entrant dispatch depth
- Mutation during dispatch (unsubscribe, subscribe, emit-different-event)
If you can’t tell me where your library breaks, you don’t know what you shipped.
The death shape
The five axes above are five rays from the origin through input space. Each one tells you where the library breaks when you push a single input to its limit. None of them tell you what happens when two inputs load each other — 1000 req_A/s might survive; 10 req_A/s + 10 req_B/s might not.
Every piece of software has an ndspace of inputs. The death shape is a surface in that space. The five axes gave us five points on it. The real surface is continuous, and most of it is uncharted.
Real systems fail along a surface.
Run it yourself
git clone https://github.com/oriongonza/rt-event-benches
cd rt-event-benches
scripts/run-stress.sh              # all languages (takes ~30 min)
scripts/run-stress.sh rust-rt-events  # one language
TIMEOUT=30 AXIS=recursive_emit_depth scripts/run-stress.sh cpp-entt
python3 scripts/aggregate-stress.py
python3 scripts/plot-stress.py
Every row of results/stress.csv carries language, library, axis, value, status, latency_ms, peak_memory_mb, death_mode, runtime_version, commit, and notes. If you disagree with a classification, the row is the source of truth.
The harness (scripts/run-stress.sh) is ~200 lines of bash; the per-language stress binaries are each ~150 lines. Add a new library by writing a stress.sh that responds to <axis> <value> with a JSON line on stdout and exits. The five axes port cleanly to any in-process dispatcher you care to put under the same microscope.
Reactions
Discussion
Public notes from logged-in readers.
Loading comments…